Cost Tools Calculators
While incentives certainly help offset the costs, they are not available in each state, and their longevity is not guaranteed. Fleets are able to realize an acceptable return on investment term without incentives when considering other factors influenced by the deployment of natural gas vehicles. In some cases, the factors may be non-monetary, such as motivations to deploy cleaner operating vehicles in a fleet.
There are many tools available online to help calculate different aspects of natural gas vehicle deployment including petroleum reduction, the return of investment, yearly savings, emissions, etc. The sections below highlight several tool fleets may find useful when considering the deployment of natural gas vehicles. The tools range in complexity, with the more basic calculators providing estimated savings and payback and more complex models addressing the cost of ownership and emission reductions. The following tools are publicly available and readers are encouraged to employ the tool that best provides the level of detail needed for their individual decision-making process.
DOE's Vehicle Cost Calculator:
Calculates total cost of ownership and emissions based on individual driving habits, comparing up to eight vehicle makes and models.
DOE National Renewable Energy Laboratory's VICE Model:
Evaluates return on investment and payback period for natural gas vehicles and infrastructure.
DOE Argonne National Laboratory's AFLEET Tool:
Calculates a fleet's petroleum use, cost of ownership, and air pollutant and greenhouse gas emissions.
Highlights of each of the four tools, along with links to each tool are included below.
DOE's Vehicle Cost Calculator
The second tool is the U.S. Department of Energy's Vehicle Cost Calculator. This vehicle cost calculator is a relatively straightforward tool that is useful for comparing two or more specific types or models of vehicles (up to a total of eight), including alternative fuel vehicles. This calculator can be found on AFDC's tool webpage or at the following web address:
http://www.afdc.energy.gov/calc/
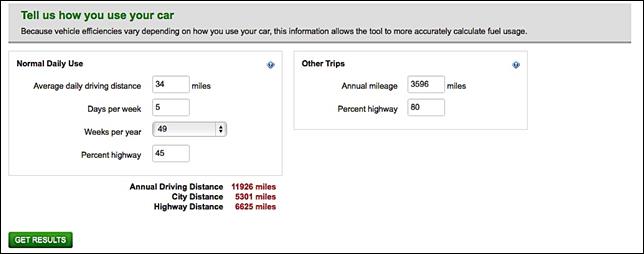
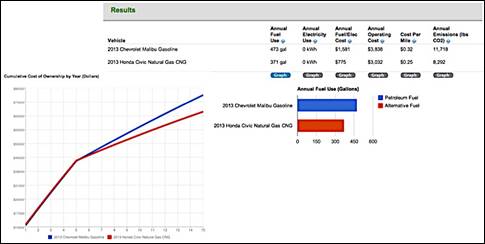
The user can pick from a list of vehicles or create their own custom vehicles as shown in Figure 7. Once the comparative vehicles have been chosen and the user has input vehicle usage data, the results provide the user with a basic cost analysis and graphs to compare each vehicle, as shown below in Figure 8.

Figure 7: AFDC's Cost Calculator Inputs

Figure 8: AFDC's Cost Calculator Results
VICE 2.0: Vehicle and Infrastructure Cash-Flow Evaluation Model
Another useful tool is the VICE model 2.0 calculator developed by DOE's National Renewable Energy Laboratory. This model is very useful for a fleet owner who is interested in the return of investment (ROI) of a natural gas fleet. The National Renewable Energy Laboratory's VICE 2.0 calculator is an Excel-based tool that helps fleet owners analyze the impact and benefits of financial investments in CNG vehicles and infrastructure. It encompasses a wide variety of vehicles and infrastructure build-outs. The VICE model 2.0 can be found and directly downloaded on AFDC's tools webpage:
http://www.afdc.energy.gov/calc/
http://www.afdc.energy.gov/tools
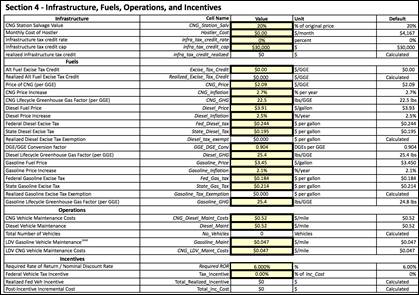
The VICE 2.0 tool is designed to effectively analyze the financials involved in switching to a CNG fleet or fueling station. Although this tool is relatively straightforward, The National Renewable Energy Laboratory included an instructions worksheet to help fleet managers easily use the tool. Figure 9 shows the inputs for both vehicles and infrastructure, which include the number of vehicles, vehicle types, fuel usage, and planned vehicle/infrastructure acquisition schedules. Default values are also provided in case-specific information about the fleet or fueling station is still unknown. Once all data has been entered, the Results worksheet provides a quantitative and graphical analysis of the total cost of ownership over time.


Figure 9: VICE 2.0 Input Examples
DOE Argonne National Laboratory's AFLEET Tool:
Alternative Fuel Life-Cycle Environment and Economic Transportation Tool
This last tool is a comprehensive Excel-based calculator that is exceptionally useful for an accurate and detailed overview of a natural gas fleet's total cost of ownership (TCO), greenhouse gas emissions, and petroleum use for both light-duty and heavy-duty vehicles. DOE's AFLEET tool, developed by the Argonne National Laboratory (ANL), uses data from ANL's Greenhouse gases, Regulated Emissions, and Energy use in Transportation (GREET) fuel-cycle model and EPA's Motor Vehicle Emissions Simulator (MOVES) to appropriately compare multiple types of alternative fuel fleet, or to their gas/diesel equivalents. The AFLEET Tool can be found on AFDC's tools page mentioned above, or to access the AFLEET tool directly, the Excel document can be downloaded at the following website:
https://greet.es.anl.gov/afleet
Because of the level of detail provided by the AFLEET Tool, a set of instructions is included as one of its worksheets to introduce new users to the tool. Along with the instructions, this tool provides a worksheet for the fleet inputs, payback inputs, total cost of ownership inputs, and footprint inputs as well as a worksheet for each of the respective results shown both numerically and graphically. Figure 10 shows the key inputs for the AFLEET Tool. These inputs include the state in which the vehicle(s) will operate; the number, the annual vehicle mileage, fuel economy, and purchase price by fuel type for both light-duty and heavy-duty vehicles; fuel price; years of planned ownership, financial assumptions; and fuel production assumptions. Default inputs are available if a fleet does not have requested information available.
Under each outputs worksheet, the user can find the results of their inputs given in a variety of tables and graphs all with detailed comparisons between the individual fleets described under the Inputs tab. Figures 11 and 12 are examples of two of the total cost of ownership (TCO) graphs given, which in this scenario, compare a diesel fleet and LNG fleet of 30 refuse trucks. In Figure 10, the total cash flow of both fleets is compared side by side over a 20-year span. Figure 11 analyzes a breakdown of the total cost of ownership for each of the described fleets over their respective lifespans. Similar results are also provided for both emissions and payback.

Figure 10: AFLEET Tool Key Inputs

Figure 11: AFLEET Tool Result 1

Figure 12: AFLEET Tool Result 2
We Help You Track Your Investment Performance
Neque porro quisquam est, qui dolore ipsum quia dolor sit amet, consectetur adipisci velit, sed quia non numquam eius modi tempora incidunt lores ta porro ame.
Join ACFC
Help guide the decisions that will impact economic development and air quality in Alabama.

